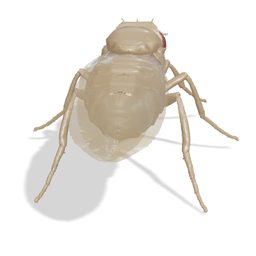
The Dancing Plague of 1518 (Strasbourg)
experimentNo. 0076categoryHistory & trainingrecordingpendingdataCC BY 4.0
The fly watches Frau Troffea dance alone in a Strasbourg street in July 1518, then dances among the afflicted through the council's stage and musicians, the ban on music and the wagon journey to the shrine of St Vitus at Saverne.
An eight-second loop from the workstation. Full recording pending publication. Follow along for the release.
What the fly saw
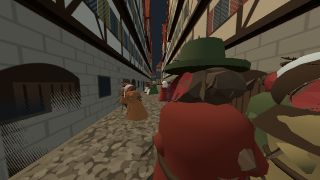
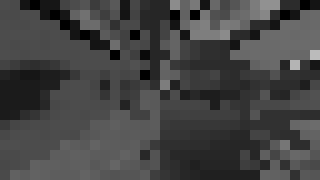
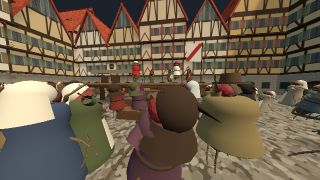
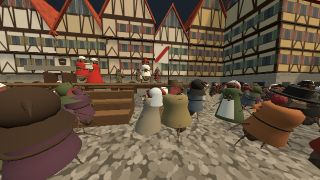
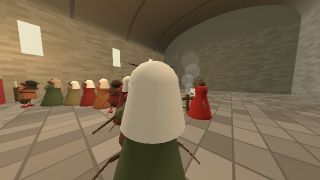
Frames rendered from the fly’s eye camera at four points in the timeline, each with the 32-column retinal input the connectome model receives at that moment.
Timeline
10 steps, with their times in the experiment
- 0:00Frau Troffea dances alone
Mid-July 1518. In a narrow Strasbourg street a woman the chronicles call Frau Troffea begins to dance, with no music. Her husband pleads from the doorway while neighbours watch. The accounts have her dancing for four to six days.
- 0:20Others join
Within a week some thirty-four others are dancing, by Waller’s count from the chronicles. Watchers gather at the edge of the square, and some of them are drawn in; the subject fly is among them.
- 0:38“Hot blood”
The council consults the city’s physicians. They rule out astrological and supernatural causes and call it a natural disease of overheated blood. Instead of bleeding the sufferers, they prescribe more dancing.
- 0:52Halls opened, a stage built
The council opens two guild halls and clears the grain market. Carpenters raise a wooden stage beside the horse market, so the afflicted can dance in public view.
- 1:10Pipes, drums and hired dancers
Paid musicians play pipes and drums from the stage, and healthy dancers are hired to keep the afflicted moving. Strong men hold up those who flag.
- 1:32August: the crowd swells
The Imlin family chronicle claims about 400 people were seized within a month; estimates run from dozens to hundreds. The often-repeated fifteen deaths a day is not confirmed by contemporary records and is not depicted. Exhausted dancers slump and are helped up again.
- 1:56The council bans music
The council reverses course and bans public music and dancing. Sebastian Brant’s notes allow only stringed instruments at weddings and first Masses, with no drums or tambourines. The musicians leave the stage.
- 2:12Wagons to Saverne
The worst afflicted are loaded into wagons for the journey to the shrine of St Vitus at Saverne, about 40 km away in the foothills of the Vosges.
- 2:28The shrine of St Vitus
Beneath a wooden image of St Vitus, priests give the dancers small crosses and red shoes, sprinkled with holy water and marked with crosses of consecrated oil on the tops and soles. The dancers are led around the altar.
- 2:50September: the dancing ends
By early September the outbreak has passed. Waller reads it as a psychic epidemic in a city worn down by famine and disease, shaped by fear of St Vitus’s curse; the explanation remains debated.
Setup
- Ten stages over 184 s, from mid-July to September 1518: Frau Troffea dances alone, others join, the physicians' "hot blood" diagnosis, halls opened and a stage built, pipes, drums and hired dancers, the August peak, the council's music ban, wagons to Saverne, the shrine of St Vitus, and the end of the dancing.
- Seventeen supporting flies (Frau Troffea, her husband, two physicians, the council clerk, two carpenters who also hold up flagging dancers, four musicians, two hired dancers, a priest, an acolyte and two afflicted dancers) and up to 400 instanced fly townsfolk.
- The square, half-timbered streets, guild halls, wooden stage, wagons and Saverne chapel are procedural models; the cathedral is a scaled approximation of the pink-sandstone west front and single north spire.
- Controls: crowd size 40–400 (default 280); dance intensity 0.4–1.6×, which also scales the fly's own motion and so its optic flow; musicians on or off (visual only; nobody plays after the ban). No audio is played.
- Cameras include Director / auto, Square / cathedral spire, Troffea's street, Stage / musicians, Subject dancer / follow, Dancer / POV, Wagons / road to Saverne and Shrine of St Vitus.
Measurement
- Retinal-only input: the eye camera looks along the fly's own heading with no roll, so the retina receives the real optic flow of its pre-programmed dancing, including a full turn in each eight-beat phrase.
- Each live window renders ten 20 ms frames; measured readouts are HS + H2 (rotation), EPG (heading) and LC4 / LPLC2 (looming).
- All dancing, crowd movement, music and ritual are pre-programmed functions of scene time and the saved controls; nothing is closed-loop.
- In a test, the fly's turning changed the retinal columns far more than watching did (about 1.1 versus 0.007 mean change per 20 ms).
Limitations
- The readouts are model responses to the retinal image only, not a model of compulsion, trance or illness; weights are fixed and nothing is learned.
- Accounts range from dozens of dancers to about 400, one chronicle's claim; the crowd-size control caps the count and is not a historical tally.
- The often-repeated fifteen deaths a day comes from later accounts; no contemporary 1518 record of a daily death rate was found, and no deaths or injuries are shown.
- Waller argues for a stress-induced psychic epidemic shaped by fear of St Vitus's curse amid famine and disease, and rejects ergotism; the explanation remains debated, and the model represents no cause.
- The streets and square are not a survey of 1518 Strasbourg; the Saverne shrine, described as a hillside chapel or grotto, is modeled as a small vaulted chapel interior.


